Last Updated on April 20, 2025 by g6nhu
For some years I’d been aware of HamClock and around April last year I decided to investigate further and built one using an old Raspberry Pi 3B that I had spare.
If you’ve never heard of HamClock, it’s described on the authors page thus:
“HamClock is a kiosk-style application that provides real time space weather, radio propagation models, operating events and other information particularly useful to the radio amateur.”
This is a very humble description for what I consider to be one of the most useful tools in my shack.
Put simply, the HamClock displays a map of the world along with various other information panels that you can customise. This is what mine looks like:
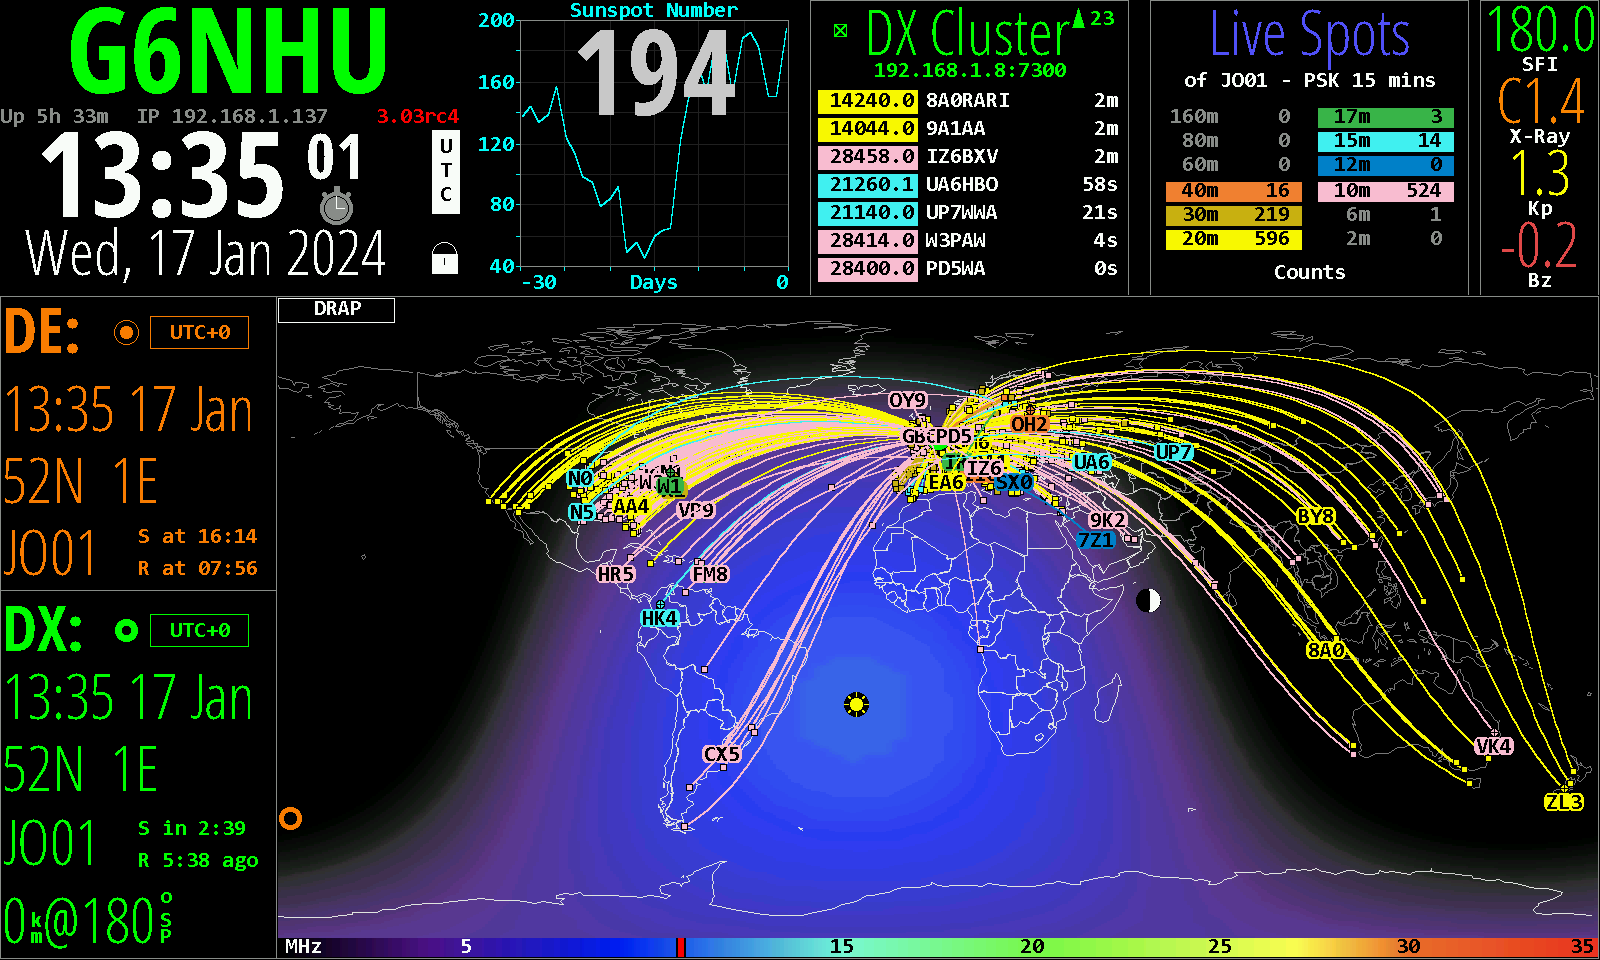
The panels
At the top left corner is my callsign and the amount of time my HamClock has been running along with the version number. If this version number is shown in red then there’s an update available (or, as in my case above, I’m using a beta version). Below that is the current time and date which I always have set showing UTC.
Moving to the right there’s a panel with the current sunspot numbers and in the background is a graph of the last thirty days.
Next to that is the DX Cluster panel. I connect to my own DX Cluster node and have quite a lot of filters set up so I only see the bands I’m interested in and only from zone 14. There’s no point in having spots shown that I’m never going to be able to work. Stations heard via the DX Cluster are plotted by callsign prefix on the main map.
The next panel is titled Live Spots, this is a link to PSK Reporter and I have it configured to show signals from JO01 square over the last fifteen minutes. This gives me a really good idea of live propagation and I can see what bands are actively being used. If I’m seeing a load of green lines out to JA land then it means that lots of Japanese amateurs are receiving signals transmitted from JO01 and if I start operating FT8 on 17m then there’s a good chance I’ll work lots of JAs.
The panel on the far right is showing space weather stats. It shows the Solar Flux Index (the current 10.7 cm measurement from National Research Council Canada), the current solar flare class and X-Ray levels, the Kp index (global geomagnetic activity index that is based on 3-hour measurements from ground-based magnetometers around the world) and the Bz number (the strength of the north pointing interplanetary magnetic field near earth in units of nano Tesla). It’s worth reading up on these stats to get an feel of what’s happening with the space weather.
The two left most panels are the DE and DX locations. DE is always your home location, it shows the time which you can set to Local, UTC or anything you like along with the location and sunrise/sunset times.
If you click on any location on the map, the DX panel will switch to that location where you can see the time, the direction, the heading and the sunrise/sunset times. I don’t use this panel, it’s just set to my home location.
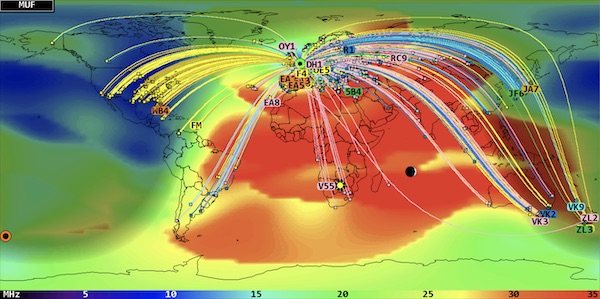
The largest panel of all on the HamClock is the map. There are many different styles of map you can have, from simple countries/terrain through to world weather, aurora and then the two I find most useful; MUF and DRAP.
Here’s a sample of the MUF map where there’s a lot going on. This map style shows the VOACAP model for median Maximum Usable Frequency between DE and other points in the world about half the time each month. Dropping down about 15% improves the path to about 90% reliability.
As can be seen from the first screenshot in this post, I use the DRAP map the most. This map style shows a near real-time display of the NOAA D Region Absorption Predictions model, or DRAP. The model predicts HF propagation absorption caused by solar X- ray and proton flux events. D layer absorption decreases with increasing frequency, so the map color-codes the highest frequency ray that is attenuated by at least 1 dB while passing through each location. I also have the night terminator visible so I can see if there’s any grey line propagation.
There are many available overlays for the map including Lat/Long, Maidenhead grid, CQ/ITU zones and there are four different projections available; Mercator, Azimuthal, Azim One and Mollweide.
As well as what I’ve described above, many other information panels are available, you can show Sun or Moon images, you can have contest information, you can see POTA/SOTA activity, there’s the option for a VOACAP graph, there’s a stopwatch, a countdown timer, you can control a rotator. There are multiple options and combinations of information that the HamClock can display.
If you’re interested in satellite communications, it can track satellites and show their live position.
How to use HamClock
Everyone’s usage will be slightly different, depending on your priorities and what you want it for so I can’t tell you how to use it. But I can tell you how I use it.
When I come into the shack, the first thing I do is switch on the monitor I have showing my HamClock. I have it on a 22″ Dell monitor so everything is clear and easy to see. I can tell which bands are currently being used to make QSOs from my grid square and I can see what DXCC entities are being spotted on the cluster. The DRAP absorption plot gives me a very good idea of what bands are likely to be working well and which may have some attenuation. An overall glance takes just a few seconds and I’ll know which band I’m going to pick first.
I think the combination of solar figures and seeing what’s happening visually on the bands is a great way to work out what’s actually going on and this makes HamClock the perfect tool. Every shack should have one!
How to install HamClock
There’s no point in me writing instructions because there are many installation guides on the internet and writing another one will just be a duplication of effort.
I wrote a guide. It’s here.
There are installation instructions on the offical HamClock website and they’re written so well that anyone can follow them. Building a HamClock is easy, it’s very straightforward and once you’ve done it, you can tweak the configuration so that it’s useful for you.
The HamClock User Guide tells you everything you need to know, it goes through all the configuration screens in great detail and explains all the available options. It’s one of the best written manuals I’ve seen for any amateur radio software application. That, along with the detailed FAQ on the website will answer almost every question that you have.
The author of HamClock is Elwood WB0OEW and if you need to contact hm for any reason, you can do so via the official website. I’ve done this a few times with some questions and suggestions and he’s been very responsive and helpful.
Linking HamClock to a DX Cluster
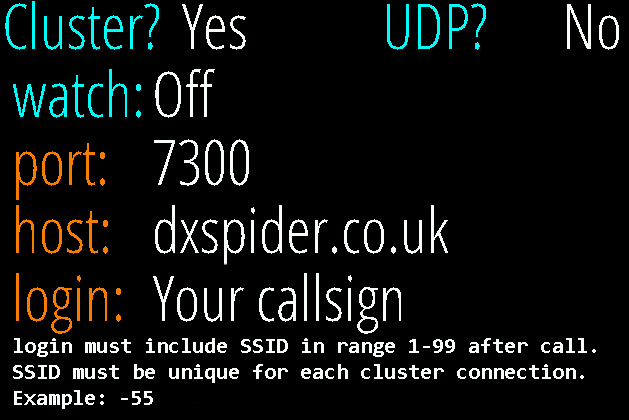
One of the most useful features of HamClock is being able to take a live DX Cluster feed and display spots on the map. My own DX Cluster node is very HamClock friendly as I’ve specifically adjusted some of the settings to prevent HamClock being disconnected during periods of high DX Cluster activity such as busy contests. If you already have a HamClock or if you build a HamClock, you may find that connecting to g6nhu-2 will give you a better experience because it’s probably the only node that has made these adjustments.
To do this, go into the HamClock settings on Page 2, set the host to dxspider.co.uk and the port to 7300. The ‘login’ field should be your own callsign (ideally with an SSID so it doesn’t get confused with any other connections into the cluster network you may have). See pages 1 and 9 of the official documentation and FAQ 10 on the official website for more details.
What does HamClock cost?
Nothing. Nada. Zero. Zip.
There is no cost for this incredible piece of software. It will run on anything from a Raspberry Pi Zero up to the latest model but there’s no point in using a RPi5 for this as it would be overkill. If you have an old Pi kicking around that you’re not using then you have nothing to lose by giving it a try. If you don’t have a Pi then I recommend you buy a Raspberry Pi Zero 2 W. You’ll also need a PSU, SD card and suitable display. I initially tried using the official Raspberry Pi 7″ touch screen but it was too small and too low resolution to give a good experience so I ended up with an old 22″ monitor I had spare.
Compare the free HamClock to the expensive commercial alternative and it’s a no brainer really.
Very helpful. Thank you!
73 es DX
Bob/AA6VB
Great very good article, very helpful.
73 de John g6cob in Shropshire
Here’s a video I made showing how to update the Inovato Quadro Hamclock with Hamclock(dot)com i also updated my Raspberry Pi Hamclock with this method!
https://youtu.be/oYgjAhL4EMI?si=A0Ifpx9_c9JNSUtf